


5 Ways to Measure (and Report on) The Impact of Learning Workflows on Workplace Performance
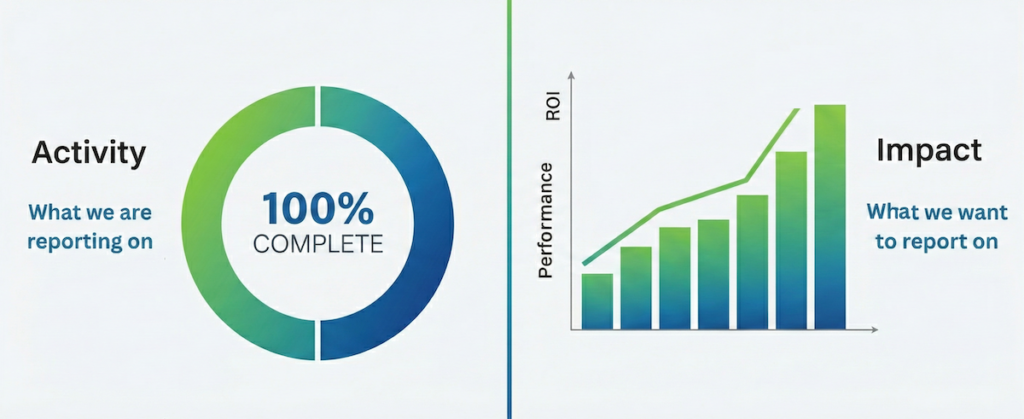
Introduction: Are You Reporting on Activity or Impact?
For decades, L&D has been reporting on “vanity metrics”: completion rates, course attendance, and learner satisfaction. These metrics tell you if people liked your training, but they tell you nothing about whether they can apply it.
In our article ´5 Things Stopping Your Learners from Applying Their Learning´, we identified the barriers to learning application in the workplace. Then in our article ´3 Actions to Connect Learning Directly to Daily Performance´, we showed how to utilise a workflow approach to connect learning directly to performance and resolve these barriers to learning application in the workplace. Now comes the most critical part: proving it works.
When you shift from isolated “training events” to organised “learning workflows,” your metrics must shift too. You stop measuring the activity and start measuring the performance.
Consider a real scenario, for example, you’re rolling out a new, complex CRM system.
- Team A (One-off Training): Receive a single classroom or e-learning course ahead of the rollout. They are “marked as complete” when they have attended the training or finished the e-learning.
- Team B (Learning Workflow): Provided with a guided set of activities that prepare the team before the rollout and support them after ‘go-live’. A mix of helpful resources, training, practice and application that follow a series of steps. For example
- Short intro videos to set the scene before a formal training course;
- Practical exercises supported by reference materials to develop hands-on experience of the CRM system;
- Assessments of the team performing ‘real’ tasks to validate they are ready to use the system.
This full set of activities is organised coherently as a “learning workflow”. The opportunity to ask questions, clarify understanding and share experiences is available throughout and on a continuous basis beyond the ‘go live’. All activities and interactions are automated as part of their workflow.
Let’s call one of these learners Sarah, imagining her experience in Team A vs Team B.
Here are 5 different ways to measure Sarah’s progress and achievements in Team A vs Team B…

Assess the gap between Learning Investment and Business Impact in your Company.
1. From 'Course Completion' to 'Task Application'
The Old Metric (Team A): “95% of Team A attended a classroom training course.”
- The Report: Sarah’s activity log is complete, she has successfully attended the training. It looks good on an L&D dashboard.
- The Reality: Sarah has not actually used the ‘live’ CRM system and has had limited opportunity to practice completing the tasks that she needs to do for her role. Sarah has to rely on asking colleagues for help when the system goes ‘live’. Sarah’s manager sees errors in her entry submissions in the CRM. Her manager has concerns that she doesn’t have the competency to use the new system.
The New Metric (Team B): “The team has successfully completed practice simulations and have been assessed using the new CRM.”
- The Report: Sarah has demonstrated application of the 5 key tasks that she has to do for her role. Sarah has generated her first outputs from the CRM system which are captured within the learning workflow to show proof of her performance achievement.
- The Value: Sarah has had hands-on experience in using the system and is able to confidently use it as soon as it goes ‘live’. Sarah’s manager was able to see Sarah develop her competence ahead of ‘go-live’ and is delighted to see Sarah seamlessly transition to using the new system.
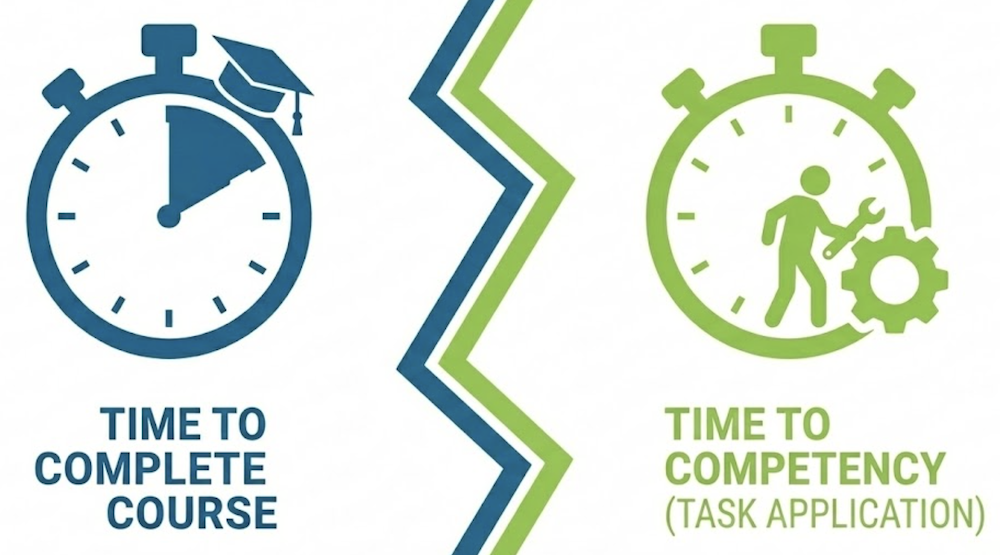
2. From 'Time to Complete' to 'Time to Competency'
The New Metric (Team B): “The average learning time was 2 hours.”
- The Report: This is a cost-based metric, focused on how much time was spent.
- The Reality: After the training, Sarah spends the next three weeks asking colleagues for help, searching the intranet, and logging support tickets.
- The Report: “Competence” is measured before and after the rollout, and time is tracked from the start of the workflow to the moment Sarah first successfully completes her tasks on her own.
- The Value: This is a powerful ROI metric. You can report on change of behaviour based on business goals.
3. From 'Disjointed´ to ´Structured´ Learning Activities
The Old Metric (Team A): “Team A logged into the LMS once to complete the eLearning course.”
- The Report: Engagement is measured by a single touchpoint.
- The Reality: No one logs back in to re-take the course to further embed their understanding. Later when she can’t recall what to do, Sarah contacts support, or looks in the company wiki in hope to find the answer she needs. A follow up face-to-face training session is organised. None of these activities are tracked since they happen outside the LMS.
The New Metric (Team B): “Sarah accessed 6 different performance support assets in her first week.”
- The Report: You track progression through the workflow. Sarah didn’t need a “course”; she needed the learning that matched where she was in her journey to performance. And for further support, she has access to 4 different checklists, a 2-minute video and she can check her understanding in peer chats, before she performs a task she is unsure of.
- The Value: This proves the learning interventions are useful, engaging, and being actively used to develop skills and build confidence. High-frequency, low-duration access is a sign of effective learning.
4. From 'Learner Satisfaction' to 'Manager Confidence'
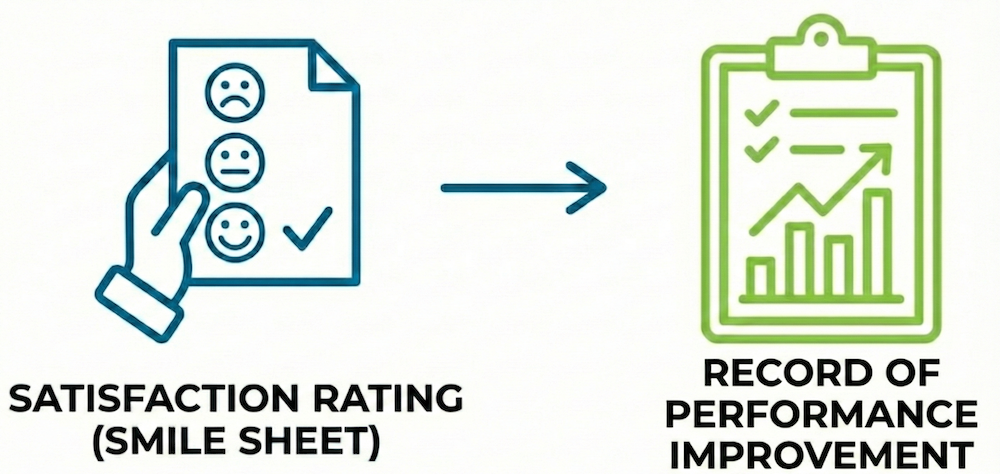
The Old Metric (Team A): “The course received a 4.2/5 ‘smile sheet’ rating.”
- The Report: This measures the quality of the entertainment (was the trainer engaging?).
- The Reality: Sarah is happy that she has completed the required training but she has not had an opportunity to apply it in her role. Neither Sarah nor her manager have proof of her level of understanding or competence.
The New Metric (Team B): “92% of managers are ‘Highly Confident’ in their team’s ability to use the new CRM.”
- The Report: The learning workflow includes a validation step for the line manager. A simple, automated prompt asks: “Has Sarah demonstrated she can build a customer report?” The manager clicks “Yes” or “No.”
- The Value: This is a leading indicator of performance. You can report directly to leadership that you are confident that the required performance improvement has been achieved.
5. From 'Vague Correlation' to 'Direct Business KPIs'
The Old Metric (Team A): “We trained 100 people. Our Q3 sales (or data accuracy) went up.”
- The Report: This is a weak correlation, not causation. Any senior leader will pick this apart.
- The Reality: You can’t prove your training did anything.
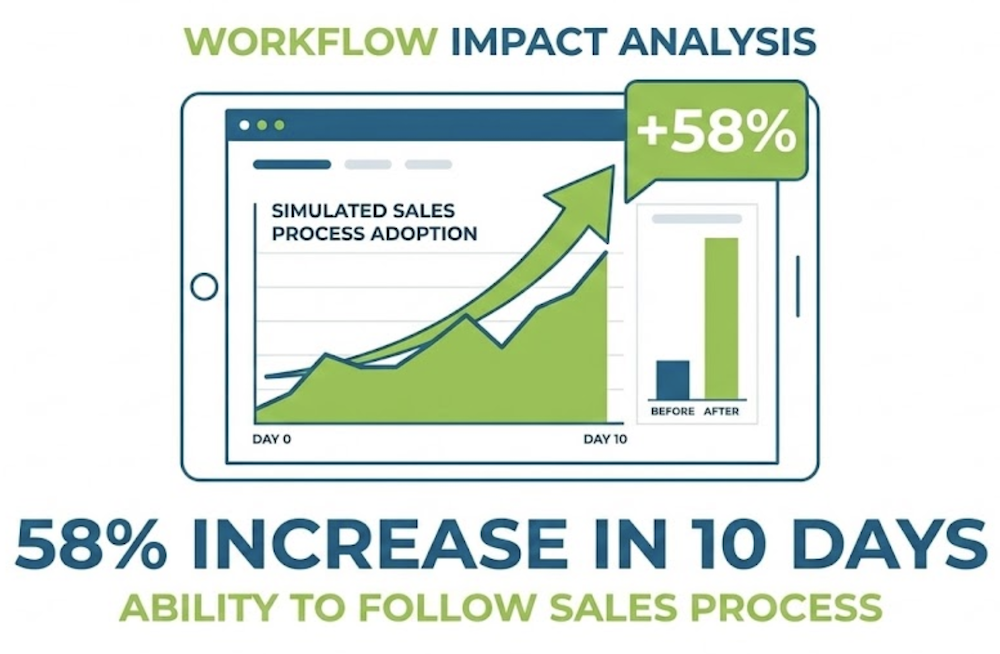
The New Metric (Team B): “After the workflow was launched, Team B’s ability to follow the sales process in a simulated environment increased by 58% in 10 days.”
- The Report: Sarah’s learning is tied directly to a specific, pre-identified business metric. She can see the connection between the learning intervention and the performance need. She knows exactly what she needs to improve, her application of the learning has been validated, and specific areas to further improve her performance have been highlighted.
- The Value: This is the ultimate goal. You are no longer reporting on L&D activity; you are reporting on business impact.
Assess the gap between Learning Investment and Business Impact in your Company.
Conclusion: Stop Reporting on Learning, Start Reporting on Performance
Measuring the impact of learning is only hard when the learning is isolated from the job. When you use learning workflows to embed performance directly into the workplace, the metrics you need are clearly visible.
This is the shift that moves L&D from a “cost centre” to a “critical driver of business performance.”
Assess the gap between Learning Investment and Business Impact in your Company.
Share this Article
X
LinkedIn
Related Resources
